Abstract

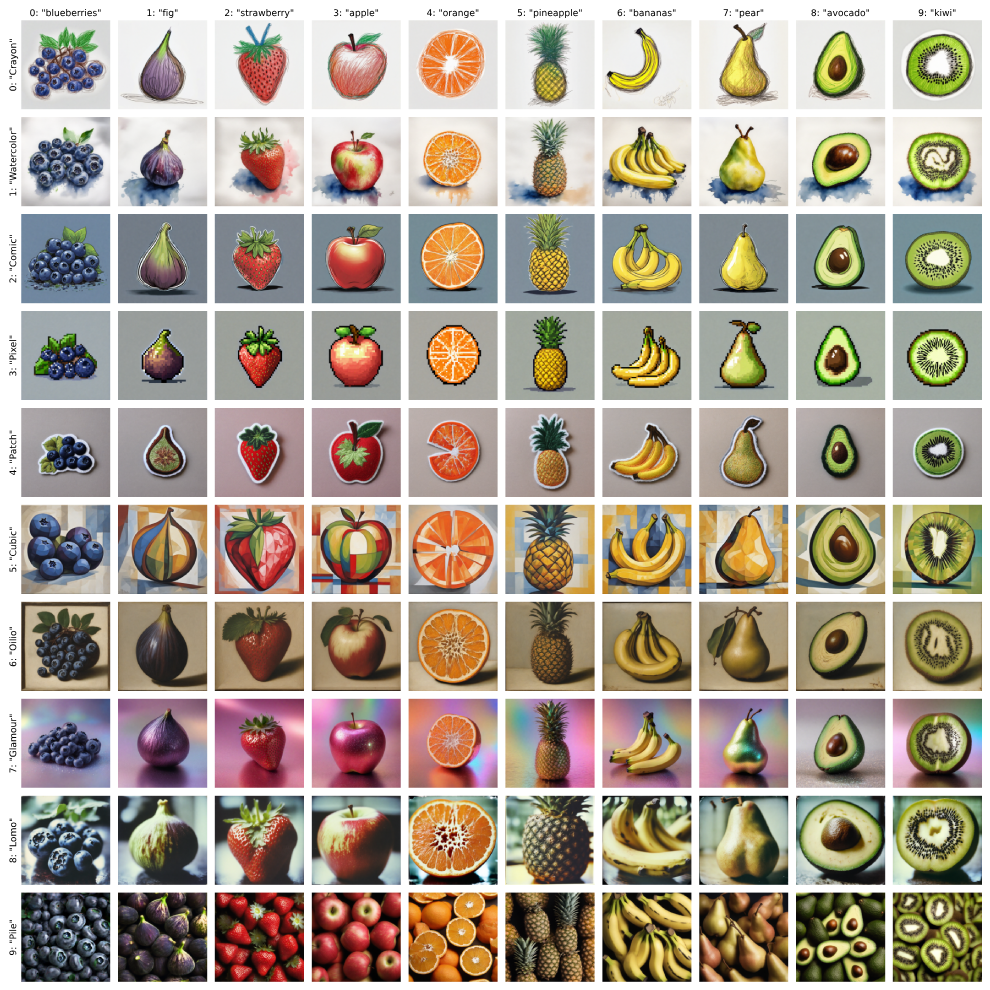
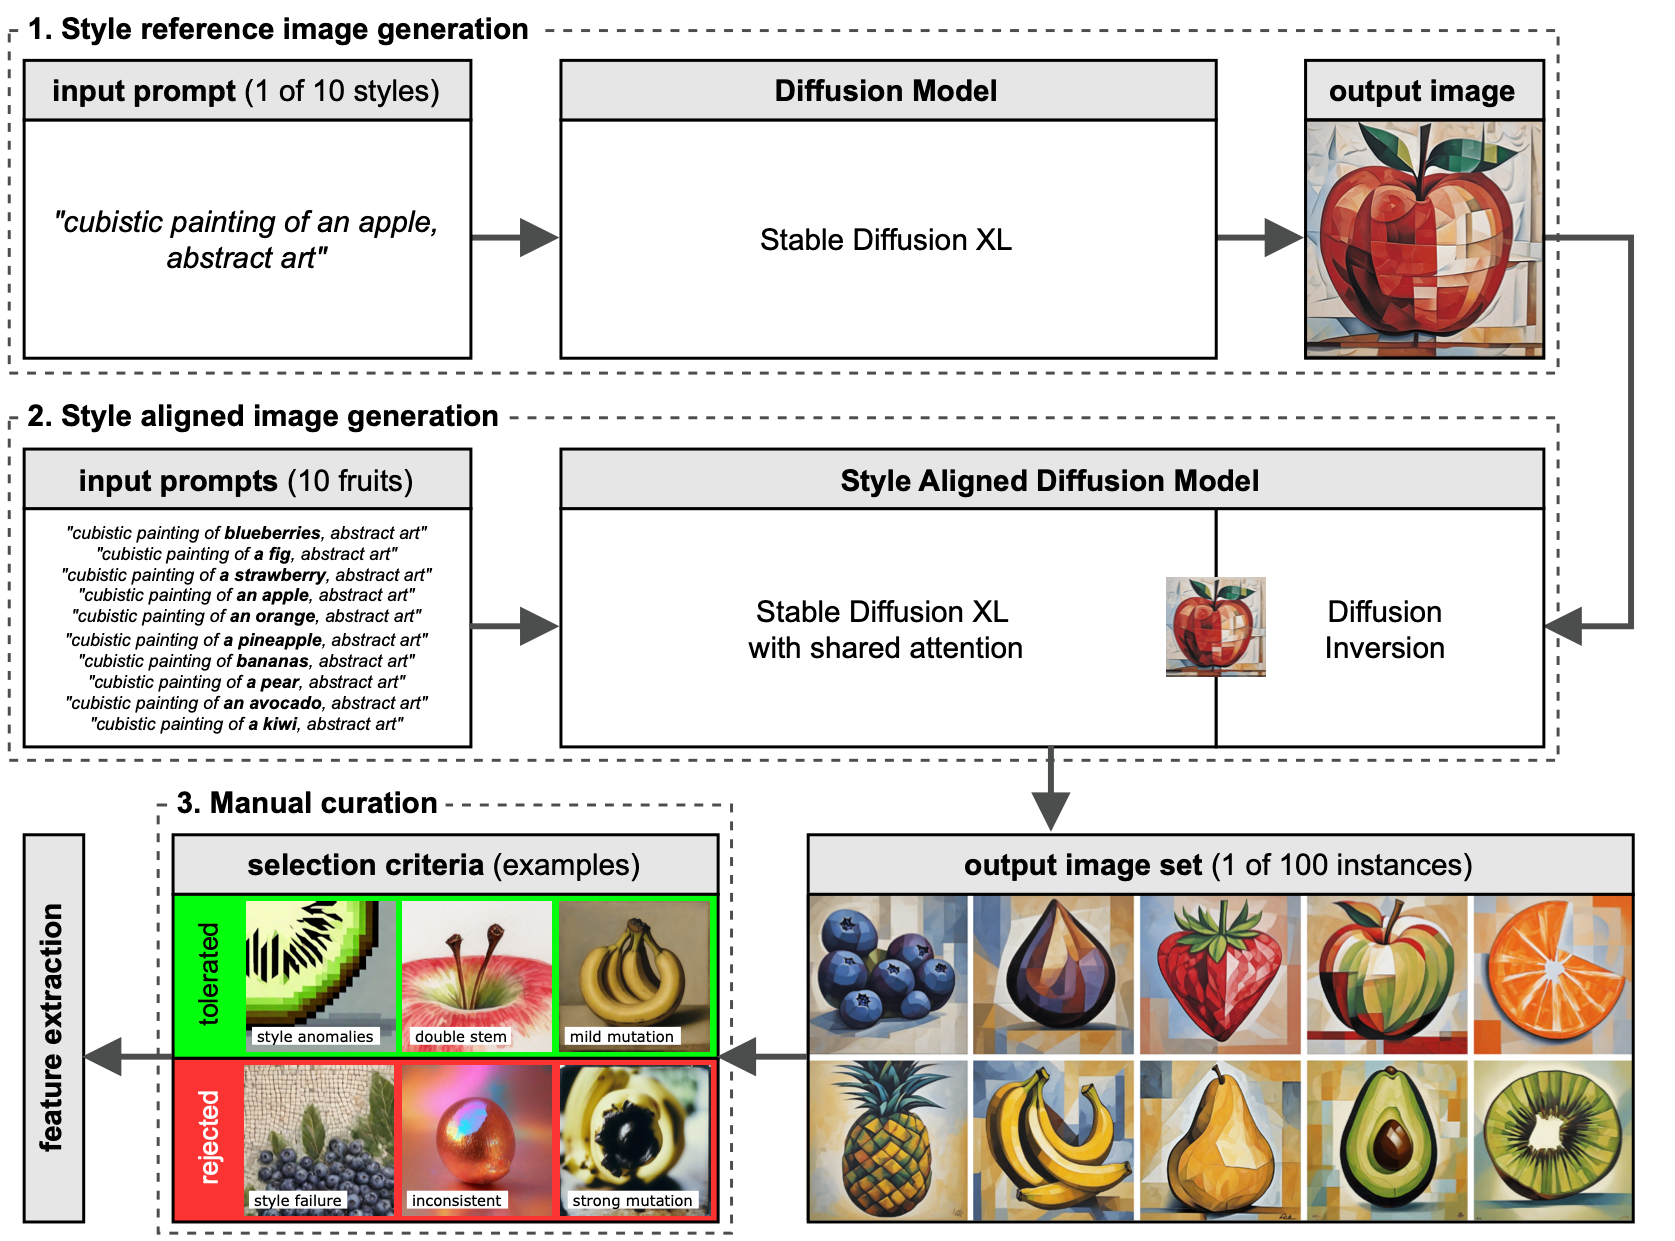
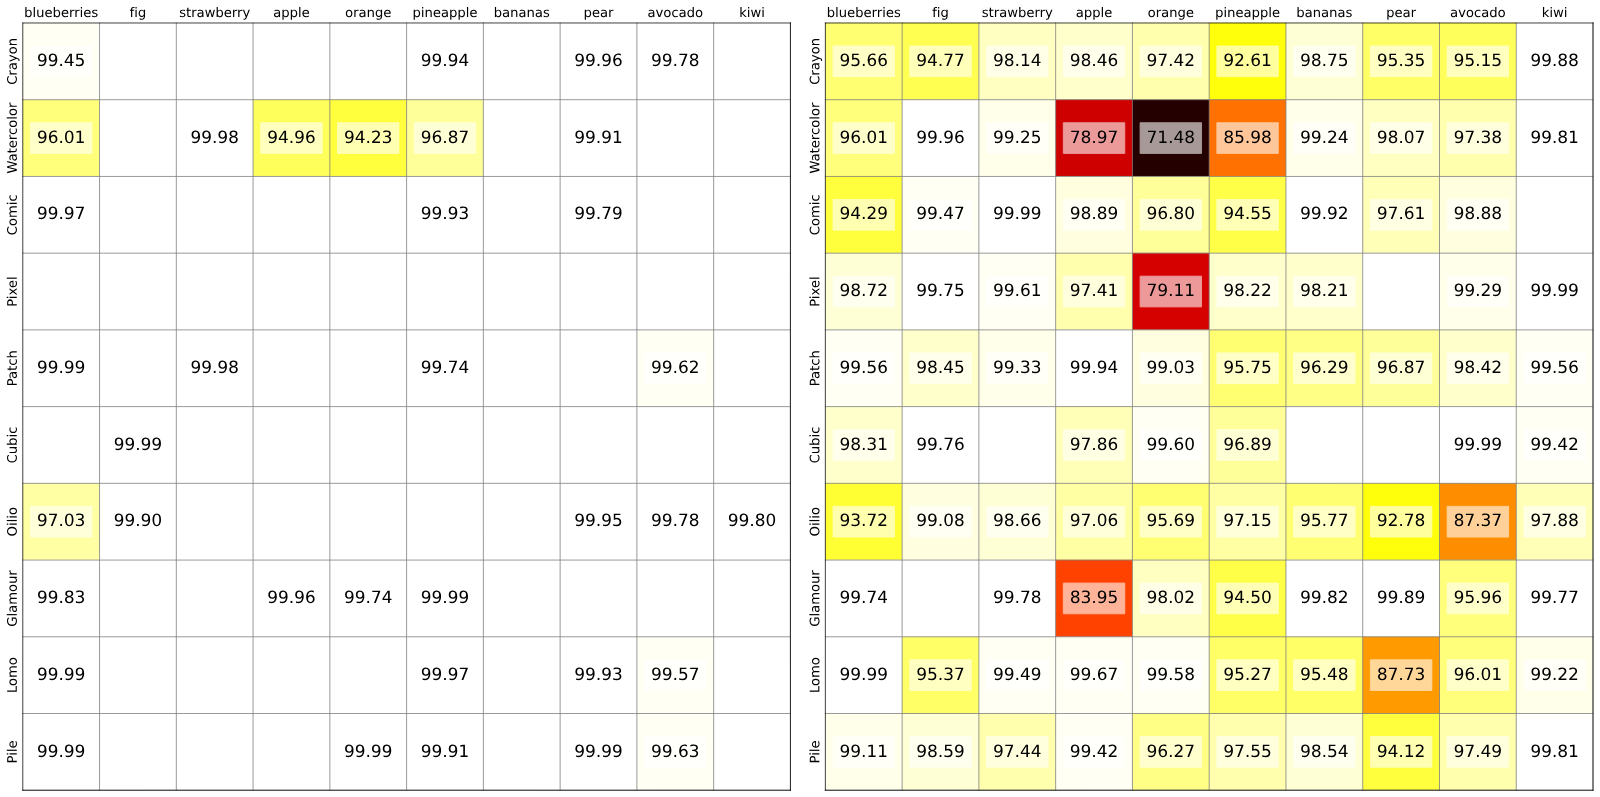
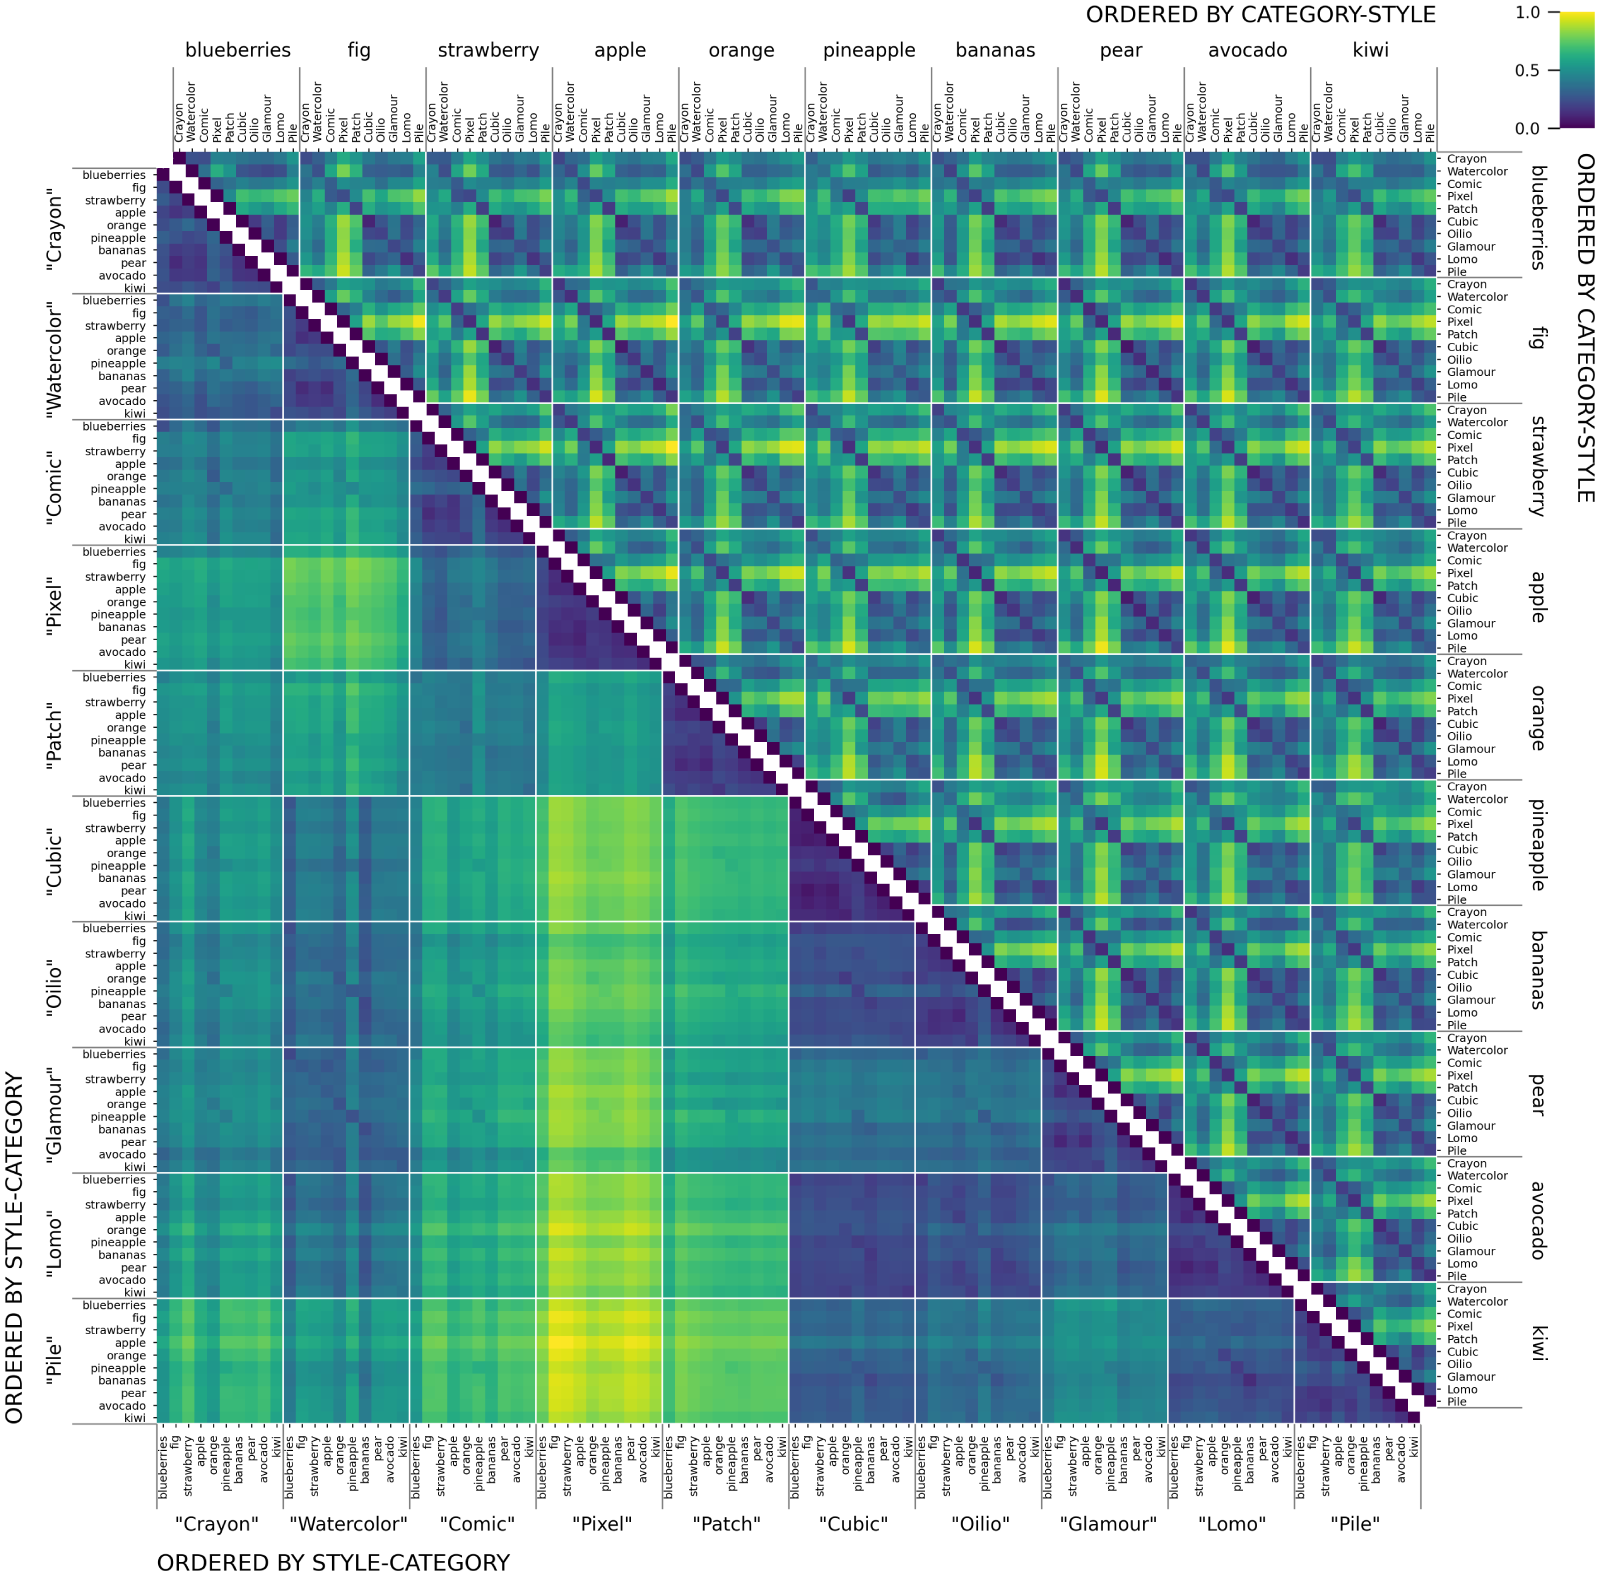
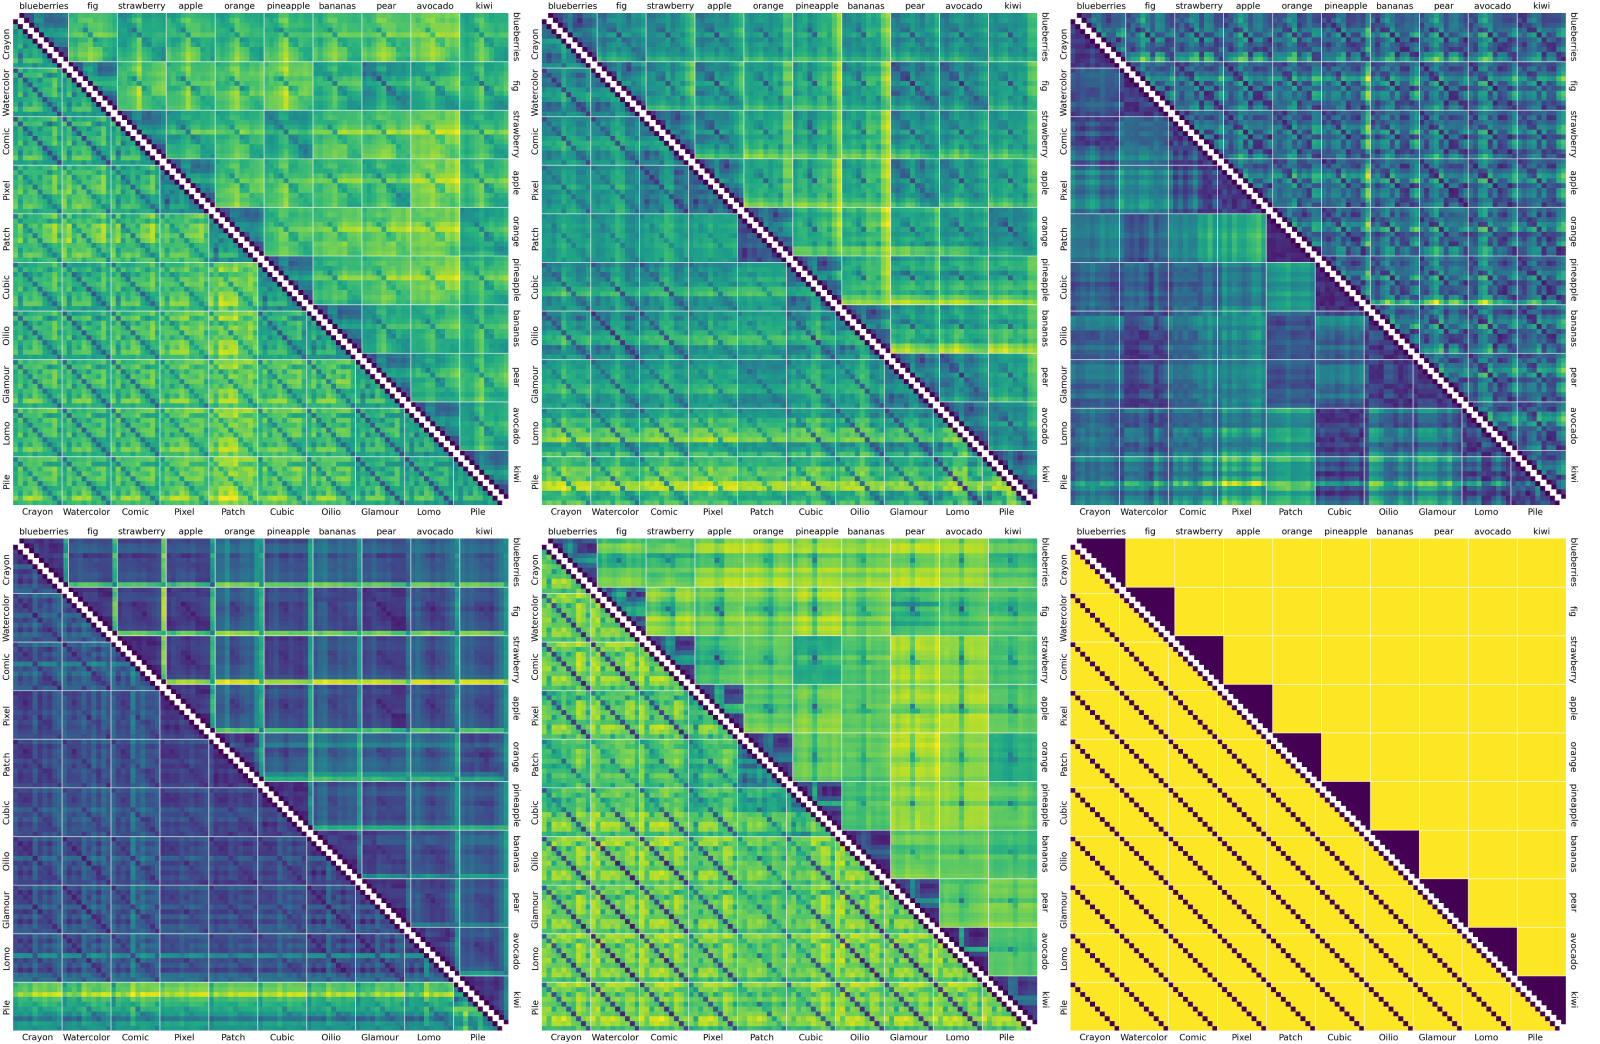
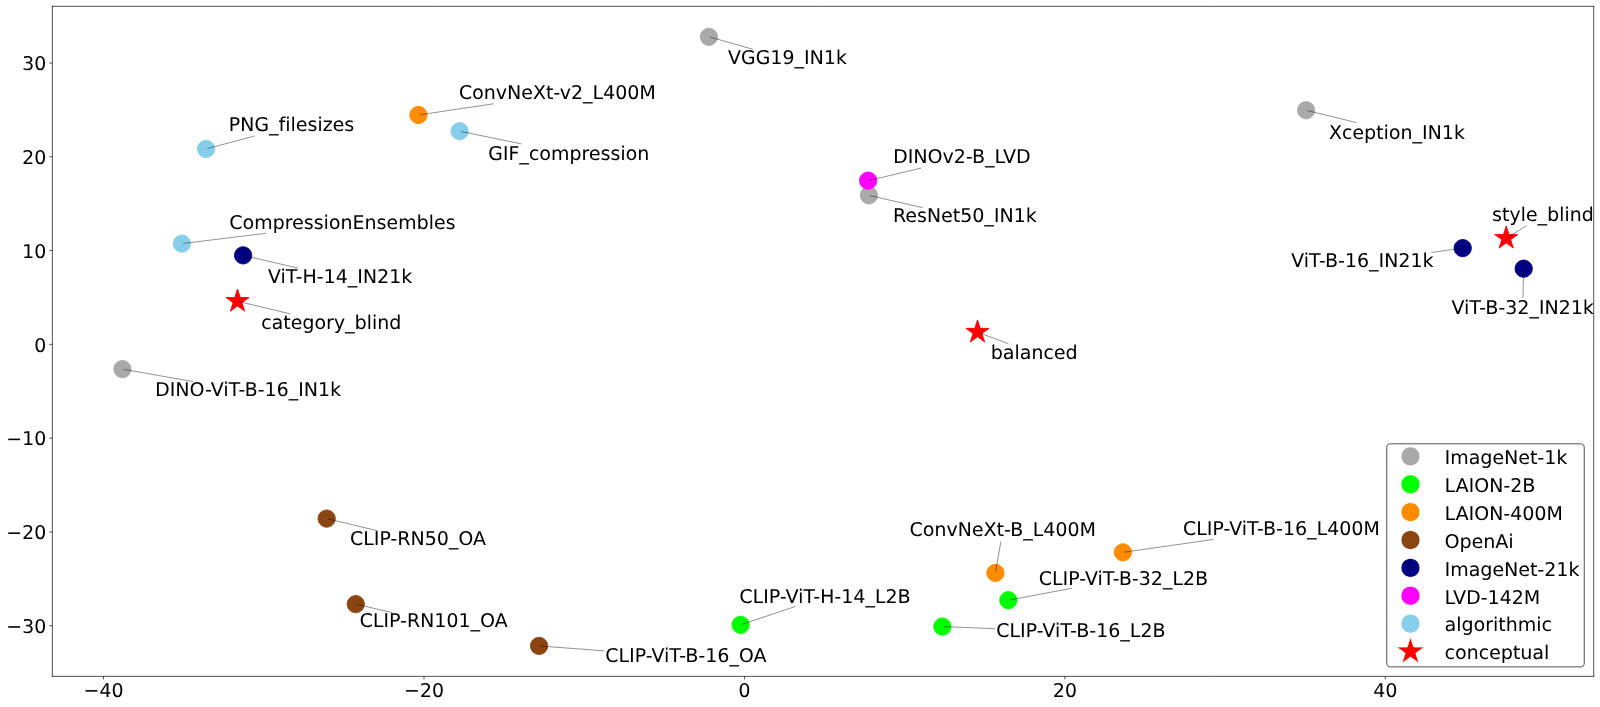
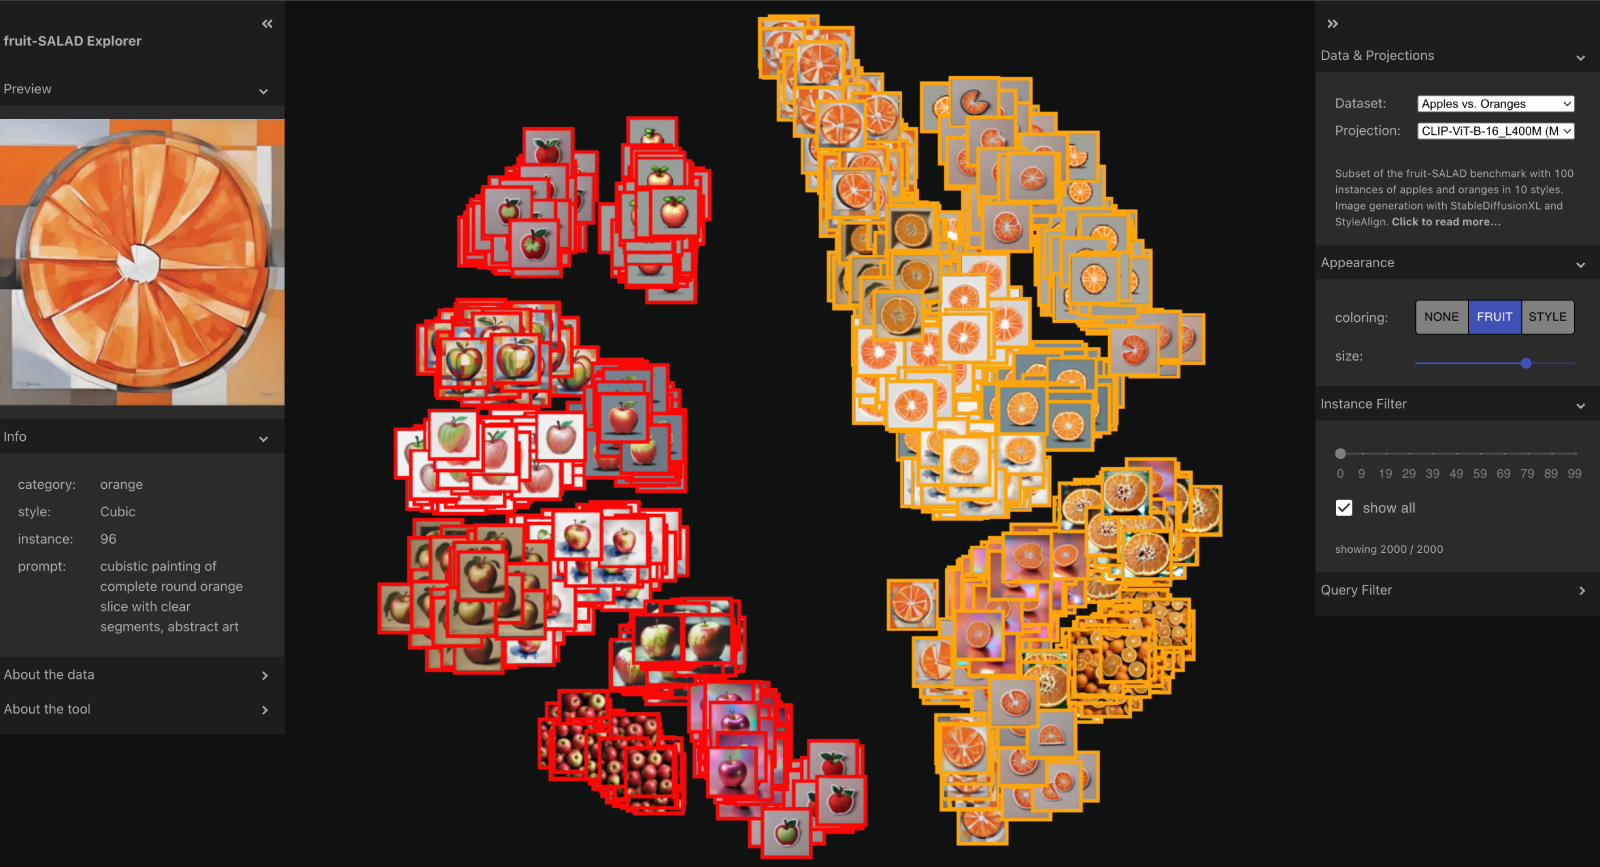
The notion of visual similarity is essential for computer vision, and in applications and studies revolving around vector embeddings of images. However, the scarcity of benchmark datasets poses a significant hurdle in exploring how these models perceive similarity. Here we introduce Style Aligned Artwork Datasets (SALADs), and an example of fruit-SALAD with 10,000 images of fruit depictions. This combined semantic category and style benchmark comprises 100 instances each of 10 easy-to-recognize fruit categories, across 10 easy distinguishable styles. Leveraging a systematic pipeline of generative image synthesis, this visually diverse yet balanced benchmark demonstrates salient differences in semantic category and style similarity weights across various computational models, including machine learning models, feature extraction algorithms, and complexity measures, as well as conceptual models for reference. This meticulously designed dataset offers a controlled and balanced platform for the comparative analysis of similarity perception. The SALAD framework allows the comparison of how these models perform semantic category and style recognition task to go beyond the level of anecdotal knowledge, making it robustly quantifiable and qualitatively interpretable.

Dataset Construction

Existing benchmark datasets lack the precise control to evaluate whether models primarily focus on the semantic category of an image (e.g., an apple) or its stylistic representation (e.g., watercolor painting). The fruit-SALAD dataset addresses this gap by offering a structured way to analyze these dimensions separately, enabling a precise study of how models weigh these factors.

The fruit-SALAD benchmark consists of 10,000 synthetic images representing:
  • 10 fruit categories (e.g., apple, banana, kiwi)
  • 10 styles (e.g., crayon, watercolor, pixel art)
  • 100 images per fruit-style combination

To generate the fruit-SALAD dataset, we developed a systematic pipeline leveraging Stable Diffusion XL (SDXL) and StyleAligned. We first experimented with various style prompts and fruit categories, selecting successful examples as reference images. Using StyleAligned with diffusion inversion, we then generated multiple instances of each fruit within the same style. After iterative refinements, we automated the process to produce 100 instances per fruit-style combination, ensuring both prototypicality and stylistic coherence. Throughout the supervised process, we manually filtered out inconsistent generations to maintain quality and coherence. As a result, the dataset inherently reflects our own biases in curating the final selection.
Overview of the image generation process.
Overview of the image generation process. 1. Style reference image generation with Stable Diffusion XL in manual trial-and-error fashion. 2. Style aligned image generation based on each style reference image. 3. Manual curation with selection criteria examples. The final step includes feature extraction to construct image embeddings for model comparison.

Comparison & Analysis

To investigate how computational models process visual similarity, we constructed image embeddings of the fruit-SALAD by extracting features with a variety of common pre-trained deep learning models, including Vision Transformers, DINO, CLIP, ResNet, and others. These models differ in architecture and training paradigms, allowing for a diverse comparison of their similarity perception. Additionally, we explored alternative representations, including our Compression Ensembles, and constructed simple reference models acting as “style_blind”, "category_blind" and "balanced".

Self-Recognition Test

We designed a self-recognition test to assess whether models could correctly identify images of the same fruit-style combination. Self-recognition was measured by counting how many matching images appeared in the top 100 nearest neighbors.

Interestingly, certain fruit-style pairs – such as apples and oranges in watercolor – proved challenging across all models, while specific combinations posed difficulties for individual models.
Self-recognition tests.
Self-recognition tests. Each cell represents the mean number of same instances in the top 100 nearest neighbors of its fruit category (column) and style (row) combination images. White cells without values have a perfect score of 100 out of 100 correctly recognized instances. Left: Maximum values from all computational models, taking into account that high scores within 100 out of 10,000 images reflect higher than chance results. Right: ResNet50_IN21k as an example model.

Model Heatmaps

To further visualize model behavior, we created “double-heatmaps” illustrating their similarity perception of the dataset. Each matrix cell represents the average distance across 10,000 image pairs. To facilitate comparison, we sorted the matrix in two different ways: below the diagonal, images are arranged first by style and then by fruit category, while above the diagonal, the order is reversed – first by fruit category and then by style.
DINO-ViT-B-16_IN1k heatmaps indicating the mutual Mahalanobis distances of fruit-SALAD images.
DINO-ViT-B-16_IN1k heatmaps indicating the mutual Mahalanobis distances of fruit-SALAD images. Below the diagonal: sorted by style first and fruit category second. Above the diagonal: sorted by fruit category first and style second. The color indicates the pairwise Mahalanobis distance of image embedding vectors obtained from the respective model or algorithm, from low to high (blue to yellow) while low values indicate higher similarity.
Heatmaps indicating the mutual Mahalanobis distance of fruit-SALAD_10k images according to different models.
Heatmaps indicating the mutual Mahalanobis distance of fruit-SALAD_10k images according to different models. Top row from left to right: CLIP-ViT-B-16_L400M, DINOv2-B_LVD, CompressionEnsembles. Bottom row from left to right: VGG19_IN1k, ViT-B-32_IN21, style_blind. The matrix ordering is identical.

Relative Model Comparison

To compare models systematically, we treated their pairwise distance matrices as multidimensional vectors and embedded them in a shared metric space. This enabled an relative comparison overview of the models, indicating patterns in how different architectures, training data, and parameters encode similarity.
Relative model comparison using principal component analysis (PCA) based on 23 standardized model vectors of 4,950 dimensions.
Relative model comparison using principal component analysis (PCA) based on 23 standardized model vectors of 4,950 dimensions. These dimensions encompass the mutual Mahalanobis distances of all unique category-style combinations of the fruit-SALAD_10k images, excluding self-pairing.

fruit-SALAD Explorer

Our interactive visualization tool enables exploration of how different models perceive similarity. To achieve this, we used projection methods such as t-SNE, UMAP, and MDS to reduce the dimensionality of image embeddings, making the differences in similarity perception across models more interpretable.
Apples vs. Oranges comparison in the fruit-SALAD Explorer.
MDS projection of CLIP-ViT-B-16_L400M image embeddings of Apples and Oranges in the fruit-SALAD Explorer.

Read More

The full fruit-SALAD paper is available on Scientific Data. You can download the entire fruit-SALAD_10k dataset including high-resolution images, various vector embeddings, and other files from Zenodo. Or read how to generate your own Style Aligned Artwork Datasets in our GitHub Repository.

Acknowledgements

All authors were supported by the CUDAN ERA Chair project for Cultural Data Analytics, funded through the European Union’s Horizon 2020 research and innovation program (Grant No. 810961).

BibTeX


@article{ohm2025FruitSALAD,
  title = {fruit-SALAD: A Style Aligned Artwork Dataset to reveal similarity perception in image embeddings},
  volume = {12},
  issn = {2052-4463},
  url = {https://doi.org/10.1038/s41597-025-04529-4},
  doi = {10.1038/s41597-025-04529-4},
  number = {1},
  journal = {Scientific Data},
  author = {Ohm, Tillmann and Karjus, Andres and Tamm, Mikhail V. and Schich, Maximilian},
  year = {2025},
  pages = {254},
}

@dataset{ohm_2024_11158522,
  author       = {Ohm, Tillmann},
  title        = {fruit-SALAD},
  month        = may,
  year         = 2024,
  publisher    = {Zenodo},
  doi          = {10.5281/zenodo.11158522},
  url          = {https://doi.org/10.5281/zenodo.11158522},
}
    

Related Work

The fruit-SALAD Explorer is based on our Collection Space Navigator.